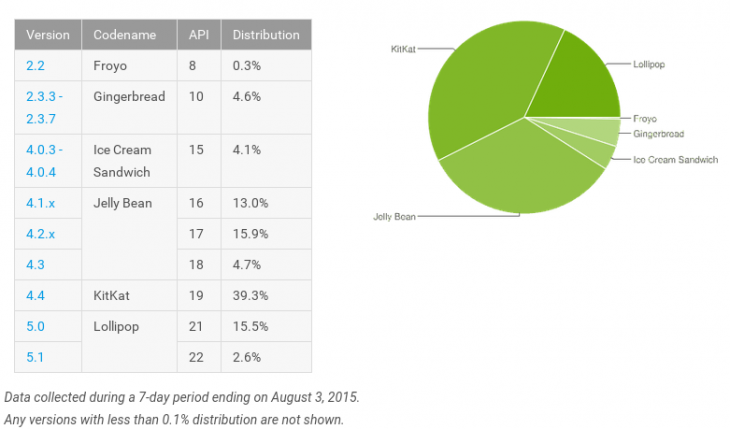
Google has this morning released their monthly report showing developers the current state of Android distribution, based on devices visiting the Play store in the 7 days leading up to August 3rd. The figures of course help developers target versions of the OS for apps, but give us a broader idea of where Google Android is currently at.
The big news is the climb of Lollipop, which when combining Android 5.0.x and 5.1.x tallies to 18.1%, nearing nearly 1/5th coverage of Android devices. The increase of nearly 4% on Android 5.0.x and 1.8% on Android 5.1.x is at the cost of nearly all the other versions of Android which for the most part declined in share, remained grudginly the same (Froyo) or gained a mere 0.1% (KitKat).
The once juggernaut that was Gingerbread, which once reigned over half of all Android devices running Google services is now down to under 5% – but it seems based on Froyo that we may be seeing it for a while to come.
For your convenience, the figure comparison from last month to this month:
| Android Version | June | July |
| Android 2.2 (Froyo) | 0.3% | 0.3% |
| Android 2.3.3 – 2.3.7 (Gingerbread) | 5.6% | 4.6% |
| Android 4.0.3 – 4.0.4 (Ice Cream Sandwich) | 5.1% | 4.1% |
| Android 4.1.x (JellyBean) | 14.7% | 13.0% |
| Android 4.2.x (JellyBean) | 17.5% | 15.9% |
| Android 4.3 (JellyBean) | 5.2% | 4.7% |
| Android 4.4 (KitKat) | 39.2% | 39.3% |
| Android 5.0 (Lollipop) | 11.6% | 15.5% |
| Android 5.1 (Lollipop) | 0.8% | 2.6% |